Market Support Programs
Single-Tranche Term Repurchase Agreements (US)
Announced: March 7, 2008
Purpose
To address heightened liquidity-related pressures in term funding and mortgage funding markets
Key Terms
- Announcement DateMarch 7, 2008
- Operational DateMarch 7, 2008
- Date of First IssuanceMarch 10, 2008
- Issuance Window Expiration DateDecember 31, 2008
- Program SizeApprox. $100 billion per month
- Peak Utilization$80 billion per week at peak
- OutcomesSingle-tranche rate spreads fell from more than 180 basis points to less than 10 bps by January 2009; one-month agency MBS repo rates declined dramatically following announcement
As mortgage defaults and foreclosures continued to climb, the severe strains that started to plague credit markets in the middle of 2007 worsened further. Losses on housing-related securities and derivative instruments continued to climb, causing substantial damage to the balance sheets of large financial institutions that had levered up on these same securities. As their positions worsened, banks found it increasingly difficult to attract funding that wasn’t priced at exorbitantly high rates or for very short terms. Term funding markets, specifically those that centered on agency mortgage-backed securities (MBS), quickly dried up as fears of illiquidity and even insolvency spread. To remedy these concerns, the Federal Reserve announced a program called the Single-Tranche Term Repurchase Agreements, which auctioned off repurchase agreements (repos) to primary Dealers every week. This provided a critical source of funding to these institutions, which, at the time, could not access other avenues of funding, such as the discount window. The repos were short term, priced at market rates, and matured 28 days after the settlement date. Of the 20 institutions categorized as primary dealers at the beginning of 2008, 19 participated in the program, which had auctions running from March 7, 2008, to December 31, 2008. Usage peaked at, but never exceeded, $80 billion per month, though the Fed said in its initial press release that the program’s size could have gone up to $100 billion. While the program was smaller compared to other market liquidity initiatives, ST OMO operated at capacity for most of its duration, and spreads between agency MBS repo and Treasury repo rates fell dramatically toward the end of the issuance window.
On March 7, 2008, the Federal Reserve announced the Single-Tranche Term Repurchase Agreements facility, a set of single-tranche open market operations (ST OMO) that were designed to alleviate severe liquidity-related stresses on the interbank lending market, particularly with respect to agency mortgage-backed securities (MBS). The program, which used Section 14 of the Federal Reserve Act as its legal basis, had primary dealers participate in a series of auctions of 28-day repurchase agreements (repos) to provide an additional mechanism for short-term funding. These institutions did not have access to facilities like the discount window, and thus their access to lender-of-last resort facilities was limited. In order to obtain repo funding, dealers also had to pledge collateral in the event they would be unable to pay the agreement back.
Eligible collateral included (1) Treasury securities, (2) federal agency debt, and (3) mortgage-backed securities that were issued or guaranteed by federal agencies. ST OMO was primarily just a series of modified conventional open market operations that the Federal Reserve Bank of New York (FRBNY) routinely conducted, with the primary difference being that normal repos had several tranches that were priced differently based on the riskiness of the underlying collateral. ST OMO, however, had only one tranche, thus allowing riskier collateral to be utilized at a lower effective rate. This was most notably seen with agency MBS, which was seen as the riskiest type of OMO collateral and was used heavily in the auctions.
The auctions began on March 7, 2008, with the first repo agreement settling on March 10. Of the 20 institutions categorized as primary dealers, 19 participated in the auctions. The auctions were conducted at market rates, which ranged from an average of about 280 bps for the set of auctions on March 7, 2008, to an average of 8 bps for those on December 31 2008. A total of 375 auctions were conducted over the program’s issuance window, totaling $855 billion in trade value. From April 30 to the expiration of the program’s issuance window on December 31, 2008, there were $80 billion in repurchase agreements outstanding, indicating considerable primary dealer participation.
In general, there was minimal formal evaluation done for ST OMO. It is possible that the program was used as a signaling device in an attempt to destigmatize participation in some of the traditional facilities, especially since most of the collateral pledged was mortgage backed securities. The program was fairly small and was announced around the same time as other programs like the Term Auction Facility (TAF), Term Securities Lending Facility (TSLF), and Primary Dealer Credit Facility (PDCF). Some suggest that, based on the consistently capped usage and falling repo rates as ST OMO wound down, the program was a success for the institutions that used it most. However, others suggest a limited US impact, since the biggest borrowers were foreign institutions such as Credit Suisse, Deutsche Bank, and BNP Paribas.
Background
By the end of 2007, signs of increasing stress on the financial system continued to grow worse. Corporate bond spreads and interbank lending spreads skyrocketed, suggesting the beginning of a freeze in lending and credit markets. The spread between the London interbank offered rate (Libor) and the overnight indexed swap (OIS) rate, often used as a proxy for counterparty credit risk in the banking system, spiked dramatically in the second half of 2007 from less than 20 basis points (bps) to nearly 80 bps after the first quarter of 2008. Additionally, the spread between one-month agency mortgage-backed securities (MBS) and Treasuries of the same maturity skyrocketed to almost 140 basis points by March 2008 (English and Mosser 2018).
Figure 1: Three-Month Libor-OIS Spread (bps) |
Source: Bloomberg. |
Figure 2: One-Month Agency MBS Repo to One-Month Treasury Repo (bps) |
Source: FRBNY Primary Dealer Survey.
Mortgage funding markets especially continued to slow, and funding became harder to access, particularly for banks that were the most exposed to the housing downturn. Primary dealers, which are large financial institutions that trade with the Federal Reserve in order to implement monetary policy, were particularly vulnerable. Primary dealers were not eligible for existing term funding programs such as the Term Auction Facility (TAF), and thus had less access. As such, the Federal Reserve decided to preempt the potential damage by issuing a series of expansive, slightly modified open market operations under Section 14 of the Federal Reserve Act of 1913 (FRA).
Program Description
The precipitous spike in mortgage defaults caused tranches of several types of mortgage-backed securities to become worthless, spreading fear regarding the creditworthiness of those institutions that were most exposed. To combat this, the Federal Reserve announced on March 7, 2008, a set of wide-ranging single-tranche open market operations (ST OMO) to help combat this growing systemic stress. Like more conventional open market operations, ST OMO was authorized under Section 14 of the Federal Reserve Act and was administered by the Federal Reserve Bank of New York (FRBNY).
In its initial announcement, the Federal Reserve specified that it expected program participation to peak at about $100 billion per month, and that, as in traditional repurchase agreements (repos), a series of auctions would be used (FRBNY 008). Of the 20 institutions categorized as primary dealers at the beginning of 2008, 19 participated to varying degrees. Primary dealers were not required to participate, but they were mandated to connect their systems to the auctions in acknowledgement of the process.
This was not the first time that the Fed had used single-tranche repo operations to address issues in term funding markets. They had done so in the 1990s, following the events of September 11, 2001, and on August 10, 2007, as conditions worsened following BNP Paribas’ freezing of $2.2 billion of funds due to an inability to value US subprime mortgage securities. (English and Mosser 2018; Kar-Gupta and Le Guernigou 2007). Additionally, traditional repos and open market operations were used to control the federal funds rate by increasing the levels of reserves in the banking system. In ST OMO, however, the purpose was much different. Due to the continued and increasingly acute strain in term funding markets, the single-tranche open market operations functioned more as an extension of conventional lender-of-last-resort facilities, rather than as a part of standard monetary Fed policy.
Normally, these varying types of collateral were spread throughout several tranches, with the price of the repo being determined by the quality of the collateral. The types of securities that were eligible as collateral, in order of least risky to most, were: (1) Treasury securities, (2) federal agency debt, and (3) mortgage-backed securities that were issued or guaranteed by federal agencies. The first (and least risky) tranche would use the collateral seen as the least risky, the second with the next least, et cetera. As ST OMO’s name implies, these same types of collateral were eligible for use in the sole tranche to help bring down the effective rate of borrowing and increase liquidity for less liquid, riskier collateral, namely agency MBS.
The first auctions, which ran weekly, were conducted on March 7, 2008, and settled on March 10, 2008. Each of the agreements, with the exception of two (at 23 days), had 28 day terms.FNBoth BNP Paribas and Credit Suisse settled one 23-day single-tranche repo each on April 7, 2008, for $6 billion and $9 billion, respectively. The auctions, which were held at market rates, had spreads between the stop-out rate and one-month OIS stay near zero from April to the beginning of September. Additionally, there were no individual caps placed on any one primary dealer’s participation, nor were there any minimums required. The Federal Reserve continued its sets of weekly auctions throughout 2008, with the final one taking place on December 31, 2008. The last of these repos expired on January 28, 2009, and no new ST OMO auctions were conducted subsequently.
Outcomes
ST OMO, along with other programs implemented in March 2008, was the start of the Fed’s heightened awareness of the growing intensity of the financial crisis. While the specific justification that the Federal Reserve cited was to address liquidity concerns in mortgage and term funding markets, it could be that the decision to use these single-tranche repo agreements was a signal by the Fed to destigmatize the participation in repo auctions and other lender-of-last-resort facilities, especially since the lion’s share of pledged collateral was agency MBS.
In the first few weeks of auctions through March and April 2008, approximately $65 billion of credit was outstanding , with 19 dealers participating. By the first week of May, the amount outstanding had risen to $80 billion, and it stayed at that level until the issuance window closed on December 31, 2008. The vast majority of the repurchase agreements were used by large, foreign banks that had substantial holdings in the USA. From July 23, 2008, to December 9, 2008, foreign primary dealers held anywhere from 81% to 98% of the outstanding single-tranche agreements.FNCalculated by dividing the amount ST OMO credit that foreign banks were holding by the total amount outstanding for each week beginning on July 23, 2008, and ending on December 9, 2008. This shows an unintended consequence of the program, as US-based primary dealers drew on the facility much less despite it being a US-specific intervention. In fact, the three largest single-tranche auction participants—Credit Suisse, Deutsche Bank, and BNP Paribas—were all foreign based.
While Bear Stearns was one of the dealers that participated in the program, it also received substantial aid in the form of assistance by the FRBNY, which created a vehicle to buy $30 billion of Bear’s bad assets to help facilitate its acquisition by JPMorgan Chase. Bear used ST OMO only once before being acquired, settling an auction on March 11, 2008, for $500 million.
While the Federal Reserve released aggregate auction results, it did not reveal how much each bank used until July 2011. Over the program’s nearly 10-month issuance window, $855 billion in gross transaction value from 375 transactions was issued. Though 19 primary dealers participated in the program, eight of them made up approximately $745 billion, or 87% of the total amount traded at the auctions.FNThe eight banks were Credit Suisse Securities (USA) LLC, Deutsche Bank Securities Inc., BNP Paribas Securities Corporation, RBS Securities Inc., Barclays Capital Inc., UBS Securities LLC, Goldman, Sachs & Company, and Morgan Stanley & Company Inc. Some institutions, such as Credit Suisse, had far greater usage than most of its counterparts. The Swiss bank was involved in more than $259 billion in ST OMO auctions over the program’s lifespan. On the opposite end of the spectrum, HSBC participated in much fewer auctions, at just $152 million. Credit Suisse, Deutsche Bank, BNP Paribas, RBS, and Barclays were the top five dealers to participate.See Figure 3 for the full list of primary dealers.
Figure 3: Total Single-Tranche Auction Participation, by Primary Dealer (USD billions) |
Note: Seven other primary dealers participated in the auctions in smaller capacities. Their approximate participation was as follows: Cantor Fitzgerald & Co., $7.93 billion; Citigroup Global Markets Inc., $7.70 billion; Dresdner Kleinwort Securities LLC, $5.26 billion; Daiwa Securities America Inc., $2.72 billion; J.P. Morgan Securities Inc., $2.50 billion; Bear, Stearns & Company, Inc., $500 million; HSBC Securities (USA) Inc., $152 million. Source: Federal Reserve Board of Governors. |
Collateral used was overwhelmingly agency MBS, as they were seen as the riskiest type of collateral and comprised a financing market rife with liquidity issues. (English and Mosser 2018). From October 8 to December 17, a period when auction rates started sky-high, 89% of submitted collateral was mortgage backed securities issued or guaranteed by federal agencies (FRBNY 2009). Demand was much larger immediately following the facility’s launch. As additional programs such as the Term Securities Lending Facility (TSLF) and Primary Dealer Credit Facility (PDCF) were introduced, amounts bid at the weekly auctions decreased, but the amount of single-tranche repos outstanding still stayed at $80 billion, indicating significant demand.
Agency MBS repo to Treasury repo spreads narrowed rapidly at the end of March as the single-tranche operations, along with other facilities, had become operational throughout the month. These spreads would shoot up again following Lehman Brothers’ bankruptcy, signaling more problems in repo markets that used agency MBS as collateral. Repo spreads would gradually narrow before falling to their pre-Lehman rates by the end of 2008.
Key Design Decisions
Purpose of MLP1
However, there were several other programs, such as the TSLF and the PDCF) that were also introduced around the same time. All of these programs were designed to alleviate stress on various funding markets, specifically term funding, triparty repo, and agency MBS (which ST OMO also aimed to address).
Legal Authority1
Unlike other crisis response programs launched in March 2008 that used Section 13(3) as their legal basis, ST OMO used Section 14, which was also the basis for the Fed’s conventional monetary policy tools, specifically its open market operations. Since ST OMO was not radically different from conventional open market operations, it used the same legal justification and did not require “unusual or exigent circumstances” as defined in Section 13(3). The program was immediately implementable because of this.
Auction or Standing Facility1
Conventional repo and reverse repo agreements, also conducted via auction, often had terms that would stretch anywhere from overnight to 65 days, though shorter-term, normally overnight, agreements were far more common.
Program Size1
However, the amount of outstanding agreements started at $65 billion before rising to $80 billion per month, or $20 billion per week, until the issuance window closed on December 31, 2008. See Figure 4 for more information.
Figure 4: Single-Tranche Repurchase Agreements Outstanding (USD billions)
Sources: Federal Reserve Board of Governors; Bloomberg (OIS).
Administration1
Since this program was essentially a set of wider-ranging open market operations, the Federal Reserve Bank of New York, which was in charge of conducting all open market operations, administered it as well.
Eligible Institutions1
Nineteen of the 20 institutions classified as primary dealers participated. However, institutions were not required to participate, only to acknowledge the auctions by connecting their systems. Only one dealer, Greenwich Capital Markets, Inc., did not participate.
Interest Rate1
At the start of the program, stop-out rates were, on average, 280 bps, then hovered around 220 bps from May 2008 to the middle of September. However, spreads between single-tranche stop-out rates and the one-month OIS rate stayed relatively low before the bankruptcy of Lehman on September 15 caused them to shoot up, peaking at more than 181 bps the week of October 8. By the final set of auctions, the stop-out rate had fallen below the one-month OIS rate, thus leading to negative spreads. Stop-out rates ranged from nearly 380 bps to just 1 bp for select auctions during the program’s lifespan.
Figure 5: Single-Tranche Stop-Out Rate to One-Month OIS Rate (bps)
Source: FRBNY.
Loan Terms1
However, there were two auctions that had 23-day terms.FNSee supra footnote 5.
Eligible Collateral or Assets1
These were usable as collateral for normal repo agreements. However, each type of security was allowed to be used for only one of the three tranches in a typical repo. For ST OMO, all three types could be pledged to the same (and only) tranche. This was done because it was likely that the majority of assets pledged as collateral would be agency MBS (Hilton 2008). Under a conventional three-tranche agreement, agency MBS used as collateral would, due to their riskiness and less-liquid nature relative to Treasuries and agency debt, demand a higher rate for the agreement. Thus, allowing all three types of securities to be pledged to the same tranche lowered the effective rate paid by most borrowers and injected liquidity into a market that, by March 2008, was almost frozen.
Participation Limit1
However, the Federal Reserve expected no more than $100 billion dollars of agreements would be outstanding at any one time.
ST OMO was not given much attention nor formal evaluation. It was simply a set of open market operations done under a lender-of-last-resort pretense rather than as part of conventional monetary policy. This led to two important distinctions. First, that the funding term for ST OMO repos was longer than for conventional repurchase agreements. Repo and reverse repo agreements conducted in normal times most commonly had overnight terms, with the longest term allowed normally being 65 days. Second, the single-tranche aspect of the program allowed agency MBS to be put up as collateral at a lower effective rate despite their underlying risk, thus providing much-needed funding to considerably strained term funding markets, which had all but frozen. However, since ST OMO was also introduced around the same time as many other programs, such as TSLF and the PDCF, it was more difficult to disentangle the stand-alone impact it had on term funding markets.
Michael J. Fleming explained that, while ST OMO had market-determined pricing, which appeared to keep auction rates high, the usage of the program and the subsequent decline in stop-out rates suggests that the auctions were priced well (Fleming 2012). Certain institutions, such as Credit Suisse, Goldman Sachs, BNP Paribas, Countrywide, and Cantor Fitzgerald, had more than half their outstanding credit at the Federal Reserve as single-tranche repos (Eisenbeis and Herring 2014). Robert Eisenbeis and Richard Herring suggested that these five primary dealers, as well as Morgan Stanley, RBS, UBS, Deutsche Bank, and Barclays, had a non-negligible amount of ST OMOs outstanding, and thus benefited quite a bit. However, for this group of dealers, the authors of the paper stated that ST OMO “had negligible impact” (Eisenbeis and Herring 2014). Generally, however, there appears to be very limited evaluation on the impact of ST OMO itself, especially compared to TAF, TSLF, and PDCF. In spite of its use as a lender-of-last-resort facility, the small size of the program ($80 billion outstanding at any given time) and standard legal basis may have contributed to a relative lack of evaluation, as well.
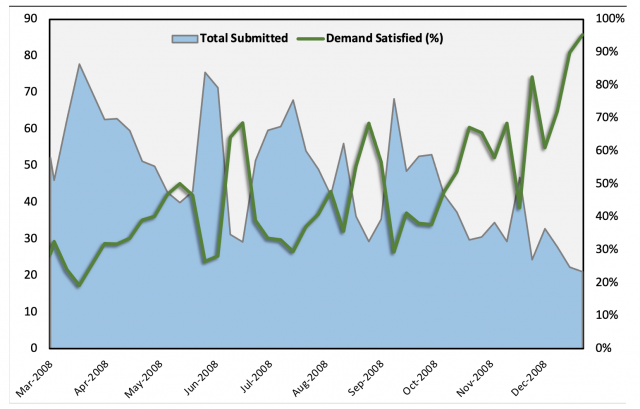
Bill English and Trish Mosser discussed some aspects of ST OMO, explaining that, “it was simple to announce and implement and was well-understood by the primary dealers, with no stigma attached to its use” (English and Mosser 2018). Additionally, since it was an FRA Section 14 program and used conventional authority, its implementation was immediate. The authors cited an immediate, verifiable positive impact on one-month repo spreads for agency MBS, which quickly fell after ST OMO and the other primary dealer programs were put in place. Initial demand was quite high for the program but tapered off once other, broader facilities were put in place.See Figure 6 for more information. Finally, they explained that, due to the comparatively narrow range of usable collateral, the program was not as effective as it could have been in easing term funding market strains (English and Mosser 2018).
Figure 6: Amounts Submitted to Single-Tranche Auctions (left axis, USD billions) and Demand Satisfied (right axis, %) |
Note: Demand Satisfied is calculated by dividing the total amount submitted by primary dealers during a given weekly single-tranche repo auction by the amount accepted by the Federal Reserve Bank of New York. Thus, it is the weekly proportion of primary dealer demand for the facility that was met by the FRBNY. In March 2008, weekly amounts accepted were $15 billion, and from the end of April to the final auction on December 31, 2008, weekly amounts accepted stayed constant at $20 billion per week. Source: FRBNY. |
Despite a lack of academic attention, in 2011, the program garnered a fair bit of press in the public sphere, most notably in an article written by Bob Ivry. He lambasted the program for being “secretive” and containing transaction-level details such as bank-specific participation, collateral used, and rates paid, that had not been revealed to anyone in the public sphere (Ivry 2011).
David Altig, executive vice president and director of research at the Federal Reserve Bank of Atlanta, challenged these criticisms, stating that he believed the transactions were not secretive, as the FRBNY had issued a press release on March 7, 2008, that specified some of the details of ST OMO. Additionally, Altig argued that the press releases, combined with the overall auction results (which were published) and the fact that the list of primary dealers was readily available, suggested that the program was far from secretive (Altig 2011).
Well-known financial journalist Felix Salmon mostly sided with Altig in the discussion about ST OMO, but he pointed out that Altig’s remarks “made the Fed seem a lot more transparent than it actually is.” Additionally, he criticized the Fed for not bothering to enhance public understanding of the program, explaining that Ivry’s article was the first time that many in the public sphere, including then–Representative Barney Frank, found out about the program (Salmon 2011).
While it is true that, in the summer of 2011, the Federal Reserve released transaction-level data for many of these programs, including ST OMO, it was forced to do so after being sued by Bloomberg reporters in November 2008 under the Freedom of Information Act (FOIA). Only after a 16-month legal battle, combined with an appeal that ended with a ruling against the Fed, did it release transaction-level data. The reluctance could have been due to a lack of desire on the part of the Fed to disclose the information of individual banks that were most vulnerable, to avoid stigma against them (Feuer 2010; Ivry and Keoun 2011).
Key Program Documents
Fast Facts: Single-Tranche Term Repurchase Agreements
Federal Reserve Bank of New York program details.
Domestic Open Market Operations during 2008
a report for the FOMC prepared by the Federal Reserve Bank of New York.
List of Primary Dealers, Federal Reserve Bank of New York
List of primary dealers , trading counterparties of the New York Fed in its implementation of monetary policy.
Key Program Documents
Statement Regarding System Open Market Account Activity, Federal Reserve Bank of New York (March 7, 2008)
Federal Reserve Bank of New York announces that the Open Market Trading Desk would conduct a series of term repurchase transactions.
Statement Regarding Open Market Operations, Federal Reserve Bank of New York (September 16, 2008)
Federal Reserve Bank of New York announces it will arrange a large overnight repo.
Restarting a Market – the Case of the Interbank Market (Bini Smaghi 2008)
speech by Lorenzo Bini Smaghi regarding the interbank market.
Bloomberg L.P., v Board of Governors of the Federal Reserve System (Preska 2009)
Lawsuit by media organization Bloomberg L.P. against the Board of Governors of the Federal Reserve System for disclosure of information.
Key Program Documents
Fed Gave Banks Crisis Gains on Secretive Loans Low as 0.01% (Ivry 2011)
Article about a Federal Reserve lending program that lent large financial institutions billions that were not disclosed to shareholders, members of Congress or the public.
‘Secret Loans’ That Were Not So Secret (Altig 2011)
Blog written by Federal Reserve economist about media coverage of a Federal Reserve lending program.
Secondary Sources: Fed Crisis Loans, Long-Term Unemployment, US Default (Izzo 2011)
A Wall Street Journal blog that rounds up key economic news from different websites.
The Fed vs Bloomberg, ST OMO Edition (Salmon 2011)
Article discussing a Federal Reserve economist's reaction to news about undisclosed lending.
BNP Freezes $2.2 bln of Funds over Subprime (Kar-Gupta and Le Guernigou 2007)
Article about a French bank freezing $2.2 billion worth of funds because of the the U.S. subprime mortgage sector.
Battle over the Bailout (Feuer 2010)
Article about a lawsuit against the Federal Reserve filed to release information about its rescue programs.
Key Program Documents
Federal Reserve Liquidity Provision during the Financial Crisis of 2007-2009 (Fleming 2012)
Article examining the Federal Reserve's liquidity provision during the Global Financial Crisis.
Recent Developments in Federal Reserve System Liquidity and Reserve Operations (Hilton 2008)
Reserve Bank of Australia report about the US Federal Reserve's liquidity and reserve operations.
Domestic Open Market Operations during 2008 (FRBNY 2009)
Report by the Federal Reserve Bank of New York's Markets Group regarding domestic open market operations during 2008.
Fed Liquidity Policy during the Financial Crisis: Playing for Time (Eisenbeis and Herring 2014)
Paper about how the Federal Reserve responded to the early stage of the Global Financial Crisis.
Default Rates on Prime and Subprime Mortgages: Differences & Similarities (Amromin and Paulson 2010)
Report by the Federal Reserve Bank of Chicago's Consumer and Community Affairs Division about prime and subprime mortgage default rates.
Connected to Whom? International Interbank Borrowing during the Global Crisis (Tintchev 2013)
International Monetary Fund working paper about the drivers of the retrenchment from 32 advanced and emerging banking systems.
The Use and Effectiveness of Conventional Liquidity Tools Early in the Financial Crisis (English and Mosser 2018)
Report about the design, use and efficacy of the Fed’s conventional lending tools during the first part of the financial crisis.
Single-Tranche Repo: United States Context | |
GDP (SAAR, Nominal GDP in LCU converted to USD) | $14,681.5 billion in 2007 $14,559.5 billion in 2008 Source: Bloomberg |
GDP per capita (SAAR, Nominal GDP in LCU converted to USD) | $47,976 in 2007 $48,383 in 2008 Source: Bloomberg |
Sovereign credit rating (5-year senior debt)
| As of Q4, 2007: Fitch: AAA Moody’s: Aaa S&P: AAA As of Q4, 2008: Fitch: AAA Moody’s: Aaa S&P: AAA Source: Bloomberg |
Size of banking system
| $9,231.7 billion in total assets in 2007 $9,938.3 billion in total assets in 2008 Source: Bloomberg |
Size of banking system as a percentage of GDP
| 62.9% in 2007 68.3% in 2008 Source: Bloomberg |
Size of banking system as a percentage of financial system
| Banking system assets equal to 29.0% of financial system in 2007 Banking system assets equal to 30.5% of financial system in 2008 Source: World Bank Global Financial Development Database |
5-bank concentration of banking system
| 43.9% of total banking assets in 2007 44.9% of total banking assets in 2008 Source: World Bank Global Financial Development Database |
Foreign involvement in banking system | 22% of total banking assets in 2007 18% of total banking assets in 2008 Source: World Bank Global Financial Development Database |
Government ownership of banking system
| 0% of banks owned by the state in 2008 Source: World Bank, Bank Regulation and Supervision Survey |
Existence of deposit insurance | 100% insurance on deposits up to $100,000 for 2007 100% insurance on deposits up to $250,000 for 2008 Source: Federal Deposit Insurance Corporation |
Taxonomy
Intervention Categories:
- Market Support Programs
Countries and Regions:
- United States
Crises:
- Global Financial Crisis